OpenTelemetry with Java: Understanding the Fundamentals
Part 1 of an 8-part series on implementing observability in Java microservices
If you’ve ever stared at logs from 10 different microservices trying to figure out why a user’s request failed, you know the pain. The request worked in dev, passed staging, but something went wrong in production—and you have no idea which service is to blame.
This is the problem observability solves. And OpenTelemetry (OTel) is now the industry standard for implementing it.
In this series, we’ll build production-ready observability into a Java microservices system. But before we write any code, let’s build the mental model.
What is Observability?
Observability is your ability to understand what’s happening inside your system by examining its outputs. Unlike traditional monitoring (which tells you that something is wrong), observability helps you understand why.
The three pillars of observability are:
1. Traces
A trace represents the journey of a single request through your distributed system. It’s like a timeline showing every service the request touched, how long each step took, and what happened at each point.
User Request → API Gateway → Order Service → Inventory Service → Payment Service
     |            5ms            12ms             8ms              45ms
Each step in this journey is called a span. Spans have:
- A name (e.g.,
POST /orders) - A duration (start time → end time)
- Attributes (metadata like
order.id,customer.id) - A parent-child relationship (creating the tree structure)
2. Metrics
Metrics are numerical measurements collected over time:
- Request counts
- Error rates
- Response time percentiles (p50, p95, p99)
- Active connections
- Queue depths
Metrics answer questions like: “How many requests per second are we handling?” or “What percentage of requests are failing?”
3. Logs
Logs are timestamped records of discrete events:
2026-01-08T10:15:30Z [INFO] Order created: orderId=12345, customerId=abc
2026-01-08T10:15:31Z [ERROR] Payment failed: orderId=12345, reason=insufficient_funds
The power comes when you correlate all three: find the error in logs, jump to the trace to see the full request flow, then check metrics to see if this is an isolated incident or a pattern.
Why OpenTelemetry?
Before OpenTelemetry, the observability landscape was fragmented:
- OpenTracing for distributed tracing
- OpenCensus for metrics and tracing
- Vendor-specific SDKs (Datadog, New Relic, Jaeger, etc.)
OpenTelemetry emerged as the merger of OpenTracing and OpenCensus, and is now a CNCF project (same foundation as Kubernetes). It provides:
| Benefit | Description |
|---|---|
| Vendor-neutral | Instrument once, export to any backend |
| Standardized | Consistent APIs across languages |
| Full coverage | Traces, metrics, AND logs |
| Auto-instrumentation | Works with zero code changes |
OpenTelemetry Architecture
Understanding OTel’s components is crucial before implementation:
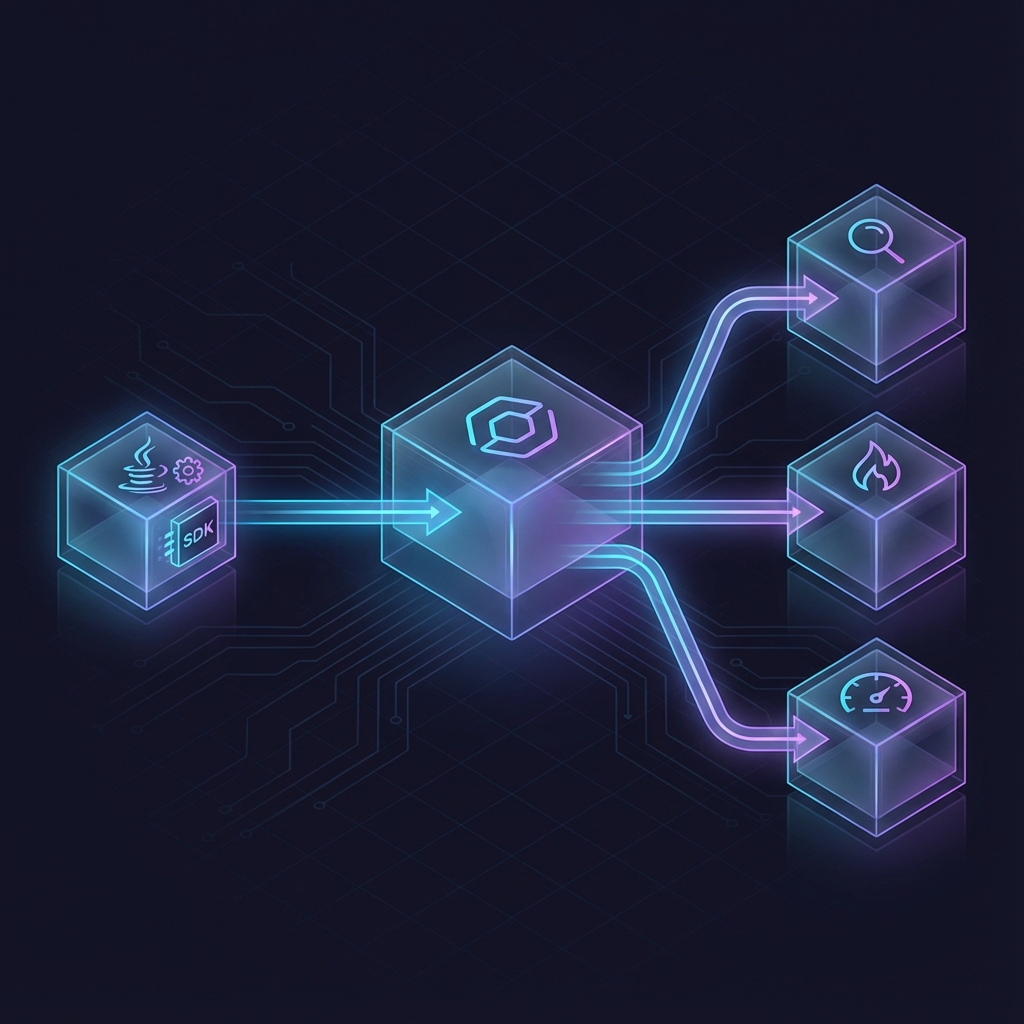
The flow: Your Java application with OTel SDK/Agent sends telemetry via OTLP to the Collector, which routes it to backends like Jaeger, Prometheus, or any vendor.
The Components
API: Interfaces for instrumentation. Lightweight, safe to use everywhere.
SDK: Implementation of the API. Configures how telemetry is processed and exported.
Java Agent: Attaches to your JVM and automatically instruments common libraries—HTTP clients, database drivers, messaging systems—with zero code changes.
Collector: A standalone service that receives, processes, and exports telemetry. Acts as a central hub for your observability pipeline.
Exporters: Send telemetry to backends (Jaeger, Prometheus, Datadog, etc.)
Key Concepts Deep Dive
Context Propagation
When Service A calls Service B, how does Service B know it’s part of the same trace?
Context propagation is the mechanism that passes trace context (trace ID, span ID) between services. OpenTelemetry uses HTTP headers (specifically W3C Trace Context):
GET /inventory/check HTTP/1.1
Host: inventory-service
traceparent: 00-0af7651916cd43dd8448eb211c80319c-b7ad6b7169203331-01
The traceparent header carries the trace ID and parent span ID, allowing the receiving service to continue the same trace.
Semantic Conventions
OpenTelemetry defines semantic conventions—standardized names for common attributes:
| Convention | Example |
|---|---|
http.request.method |
GET, POST |
http.response.status_code |
200, 500 |
db.system |
postgresql, mysql |
service.name |
order-service |
deployment.environment |
production |
Using these conventions means your telemetry works consistently with dashboards and tools across the ecosystem.
Resources
A resource identifies the entity producing telemetry:
service.name: order-service
service.version: 1.2.3
deployment.environment: production
host.name: pod-xyz-123
Resources are attached to all telemetry, enabling filtering like “show me all traces from order-service in production.”
Auto vs Manual Instrumentation
OpenTelemetry offers two instrumentation approaches:
Auto-Instrumentation (Zero-Code)
Attach the Java agent to your JVM:
java -javaagent:opentelemetry-javaagent.jar -jar myapp.jar
What you get automatically:
- HTTP server/client spans (Spring MVC, Servlet, RestTemplate, WebClient)
- Database spans (JDBC, Hibernate)
- Messaging spans (Kafka, RabbitMQ)
- gRPC spans
- And 100+ other libraries
Pros: Fast rollout, no code changes, consistent across services
Cons: Less control over span names and attributes
Manual Instrumentation
Add custom spans and attributes for business context:
@WithSpan("process-payment")
public PaymentResult processPayment(
    @SpanAttribute("order.id") String orderId) {
    // Your business logic
}
Pros: Full control, business-relevant context
Cons: Requires code changes, more maintenance
Best practice: Start with auto-instrumentation, then add manual instrumentation where you need business context.