Zero to Tracing in 15 Minutes
Part 2 of an 8-part series on implementing observability in Java microservices
In Part 1, we built the mental model for OpenTelemetry. Now it’s time to get our hands dirty.
By the end of this article, you’ll have distributed tracing working across multiple microservices with zero code changes. We’ll use the OpenTelemetry Java Agent for auto-instrumentation and Jaeger for visualization.
What We’re Building
We’ll set up a simple e-commerce flow:
User → Order Service → Inventory Service → Payment Service
Each service will automatically create spans, and we’ll see the complete trace in Jaeger.
Prerequisites
- Java 17+
- Docker & Docker Compose
- Maven or Gradle
- 15 minutes ☕
Step 1: Set Up Jaeger with Docker
First, let’s get Jaeger running locally. Create a docker-compose.yml:
version: '3.8'
services:
  jaeger:
    image: jaegertracing/all-in-one:1.53
    container_name: jaeger
    ports:
      - "16686:16686"   # Jaeger UI
      - "4317:4317"     # OTLP gRPC
      - "4318:4318"     # OTLP HTTP
    environment:
      - COLLECTOR_OTLP_ENABLED=true
Start it:
docker-compose up -d
Open http://localhost:16686 — you should see the Jaeger UI.
Step 2: Download the OpenTelemetry Java Agent
The OTel Java Agent automatically instruments your application without code changes.
# Download the latest agent
curl -L -o opentelemetry-javaagent.jar \
  https://github.com/open-telemetry/opentelemetry-java-instrumentation/releases/latest/download/opentelemetry-javaagent.jar
Place it in your project root or a shared location.
Step 3: Create the Demo Services
For this demo, we’ll create three simple Spring Boot services. Here’s the Order Service:
Order Service (port 8080)
@RestController
@RequestMapping("/orders")
public class OrderController {

    private final RestTemplate restTemplate;

    public OrderController(RestTemplateBuilder builder) {
        this.restTemplate = builder.build();
    }

    @PostMapping
    public ResponseEntity<Order> createOrder(@RequestBody OrderRequest request) {
        // Check inventory
        Boolean available = restTemplate.getForObject(
            "http://localhost:8081/inventory/check?sku=" + request.getSku(),
            Boolean.class
        );

        if (!available) {
            return ResponseEntity.badRequest().build();
        }

        // Process payment
        PaymentResult payment = restTemplate.postForObject(
            "http://localhost:8082/payments",
            new PaymentRequest(request.getAmount()),
            PaymentResult.class
        );

        Order order = new Order(UUID.randomUUID().toString(), "CONFIRMED");
        return ResponseEntity.ok(order);
    }
}
Inventory Service (port 8081)
@RestController
@RequestMapping("/inventory")
public class InventoryController {

    @GetMapping("/check")
    public Boolean checkInventory(@RequestParam String sku) {
        // Simulate DB lookup
        try {
            Thread.sleep(50); // Simulate latency
        } catch (InterruptedException e) {
            Thread.currentThread().interrupt();
        }
        return true;
    }
}
Payment Service (port 8082)
@RestController
@RequestMapping("/payments")
public class PaymentController {

    @PostMapping
    public PaymentResult processPayment(@RequestBody PaymentRequest request) {
        // Simulate payment processing
        try {
            Thread.sleep(100); // Simulate external API call
        } catch (InterruptedException e) {
            Thread.currentThread().interrupt();
        }
        return new PaymentResult("SUCCESS", UUID.randomUUID().toString());
    }
}
Step 4: Run with the OTel Agent
Now the magic happens. Run each service with the Java Agent attached:
Order Service
java -javaagent:opentelemetry-javaagent.jar \
  -Dotel.service.name=order-service \
  -Dotel.exporter.otlp.endpoint=http://localhost:4317 \
  -Dotel.traces.exporter=otlp \
  -jar order-service/target/order-service.jar
Inventory Service
java -javaagent:opentelemetry-javaagent.jar \
  -Dotel.service.name=inventory-service \
  -Dotel.exporter.otlp.endpoint=http://localhost:4317 \
  -Dotel.traces.exporter=otlp \
  -jar inventory-service/target/inventory-service.jar
Payment Service
java -javaagent:opentelemetry-javaagent.jar \
  -Dotel.service.name=payment-service \
  -Dotel.exporter.otlp.endpoint=http://localhost:4317 \
  -Dotel.traces.exporter=otlp \
  -jar payment-service/target/payment-service.jar
Step 5: Make a Request and View the Trace
Send a test request:
curl -X POST http://localhost:8080/orders \
  -H "Content-Type: application/json" \
  -d '{"sku": "LAPTOP-001", "amount": 999.99}'
Now open Jaeger UI at http://localhost:16686:
- Select order-service from the Service dropdown
- Click Find Traces
- Click on the trace to see the full timeline
You should see a beautiful waterfall visualization showing:
POST /orders(order-service)GET /inventory/check(inventory-service)POST /payments(payment-service)
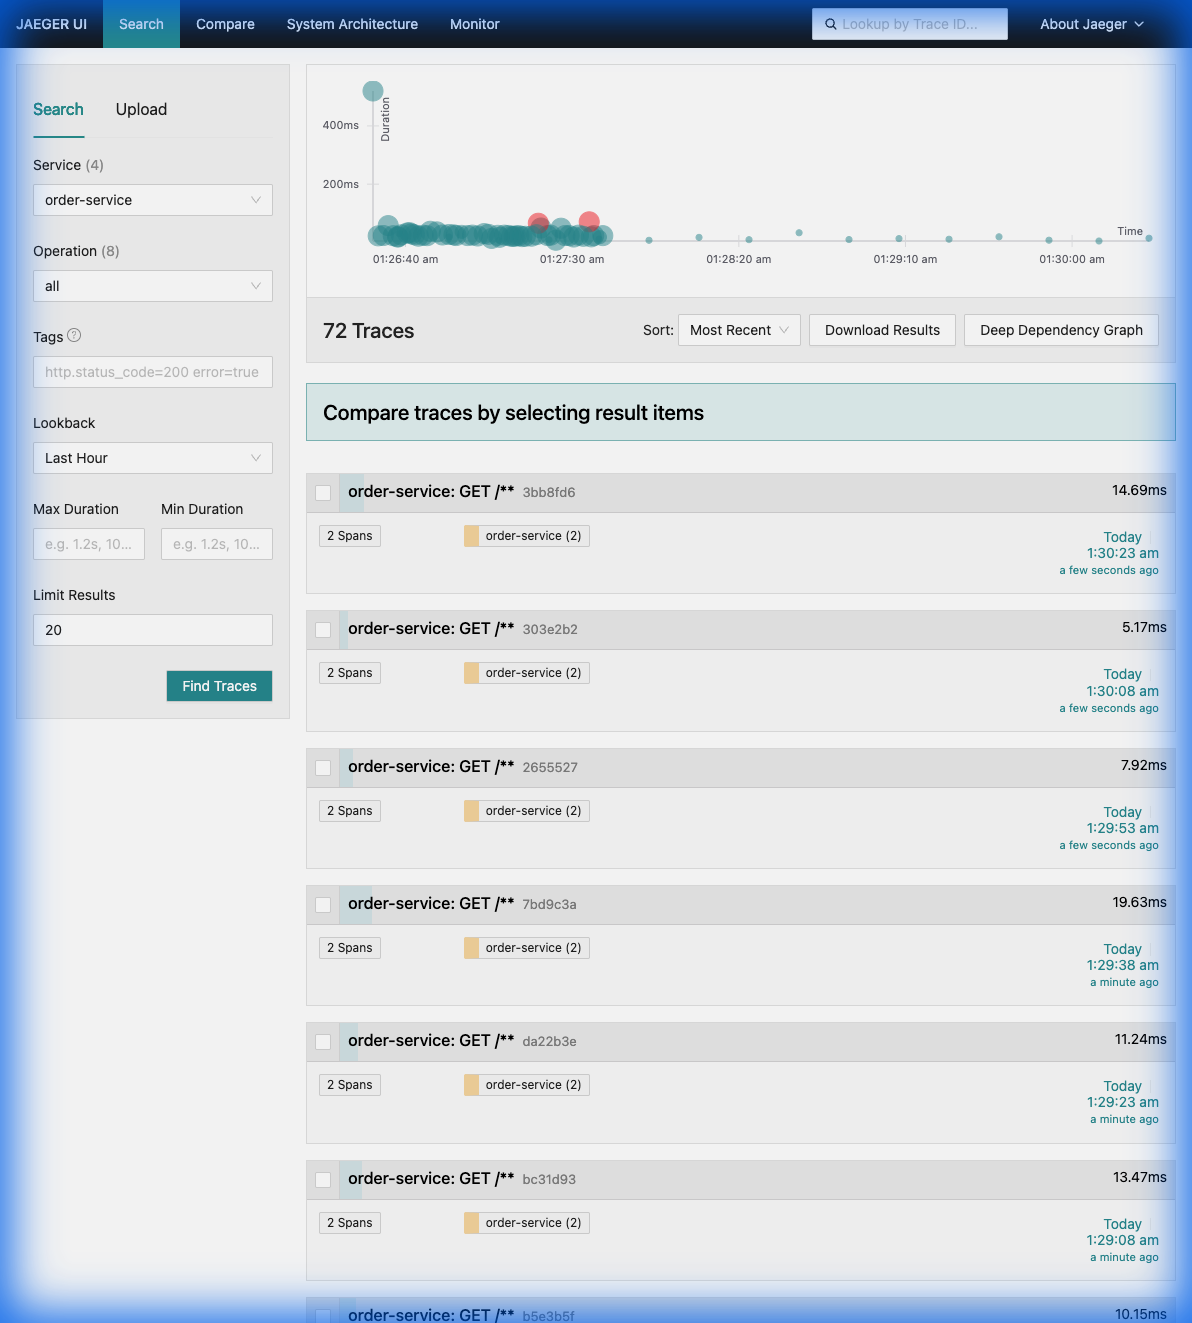 Above: A real-world example of distributed traces in Jaeger showing the flow from Order → Inventory → Payment.
[!TIP] Hands-On Lab: Want to see this in action yourself? Check out the complete working demo in the
otel-demodirectory. It includes a one-click Docker Compose setup with all three services, the collector, Jaeger, Prometheus, and Grafana pre-configured.
What the Agent Instruments Automatically
The OTel Java Agent provides out-of-the-box instrumentation for:
| Library/Framework | What’s Traced |
|---|---|
| Spring MVC | Incoming HTTP requests |
| RestTemplate/WebClient | Outgoing HTTP calls |
| JDBC | Database queries |
| Kafka | Producer/Consumer operations |
| gRPC | Client and server calls |
| Redis | Cache operations |
| 100+ more… | Full list |
Key Configuration Options
| Environment Variable | Description |
|---|---|
OTEL_SERVICE_NAME |
Your service name (required) |
OTEL_EXPORTER_OTLP_ENDPOINT |
Where to send traces |
OTEL_TRACES_EXPORTER |
otlp, jaeger, zipkin, none |
OTEL_TRACES_SAMPLER |
always_on, always_off, parentbased_traceidratio |
OTEL_TRACES_SAMPLER_ARG |
Sampling ratio (0.0 to 1.0) |
Using Environment Variables (Recommended)
Instead of JVM args, use environment variables for cleaner configuration:
export OTEL_SERVICE_NAME=order-service
export OTEL_EXPORTER_OTLP_ENDPOINT=http://localhost:4317
export OTEL_TRACES_EXPORTER=otlp

java -javaagent:opentelemetry-javaagent.jar -jar order-service.jar
Troubleshooting
No traces appearing?
- Check Jaeger is running:
docker ps - Ensure OTLP endpoint is correct (port 4317 for gRPC)
- Add
-Dotel.javaagent.debug=truefor verbose logging
Missing spans for a library? Check if it’s in the supported libraries list.
What’s Next
Now you have distributed tracing with zero code changes. But the auto-generated spans are generic. In Part 3, we’ll add:
- Custom spans for business operations
- Business attributes (
orderId,customerId) - Exception recording and events
The traces will become much more useful for debugging real production issues.