Metrics That Matter
Part 5 of an 8-part series on implementing observability in Java microservices
Traces tell you what happened to a single request. Metrics tell you what’s happening across all requests. Together, they give you complete observability.
In this article, we’ll add custom metrics to our microservices using OpenTelemetry, export them to Prometheus, and visualize them in Grafana.
Understanding Metric Types
OpenTelemetry supports three primary metric instruments:
1. Counter
Counters only go up. Perfect for counting events.
// Examples: request count, orders created, errors
LongCounter requestCounter = meter.counterBuilder("http.requests")
    .setDescription("Total HTTP requests")
    .build();

requestCounter.add(1);
2. Gauge
Gauges represent current values that can go up or down.
// Examples: active connections, queue size, memory usage
meter.gaugeBuilder("connection.pool.active")
    .setDescription("Active database connections")
    .buildWithCallback(measurement -> {
        measurement.record(connectionPool.getActiveCount());
    });
3. Histogram
Histograms capture value distributions—essential for latency percentiles.
// Examples: request duration, response size
DoubleHistogram latencyHistogram = meter.histogramBuilder("http.request.duration")
    .setDescription("Request latency")
    .setUnit("ms")
    .build();

latencyHistogram.record(responseTime);
Setting Up Metrics Collection
Add Dependencies
<dependency>
    <groupId>io.opentelemetry</groupId>
    <artifactId>opentelemetry-api</artifactId>
    <version>1.34.0</version>
</dependency>
Update Docker Compose
Add Prometheus and Grafana to your stack:
version: '3.8'
services:
  jaeger:
    image: jaegertracing/all-in-one:1.53
    ports:
      - "16686:16686"
      - "4317:4317"
    environment:
      - COLLECTOR_OTLP_ENABLED=true

  prometheus:
    image: prom/prometheus:v2.48.0
    ports:
      - "9090:9090"
    volumes:
      - ./prometheus.yml:/etc/prometheus/prometheus.yml
    command:
      - '--config.file=/etc/prometheus/prometheus.yml'

  grafana:
    image: grafana/grafana:10.2.0
    ports:
      - "3000:3000"
    environment:
      - GF_SECURITY_ADMIN_PASSWORD=admin
Prometheus Configuration
Create prometheus.yml:
global:
  scrape_interval: 15s

scrape_configs:
  - job_name: 'order-service'
    static_configs:
      - targets: ['host.docker.internal:8080']

  - job_name: 'inventory-service'
    static_configs:
      - targets: ['host.docker.internal:8081']

  - job_name: 'payment-service'
    static_configs:
      - targets: ['host.docker.internal:8082']
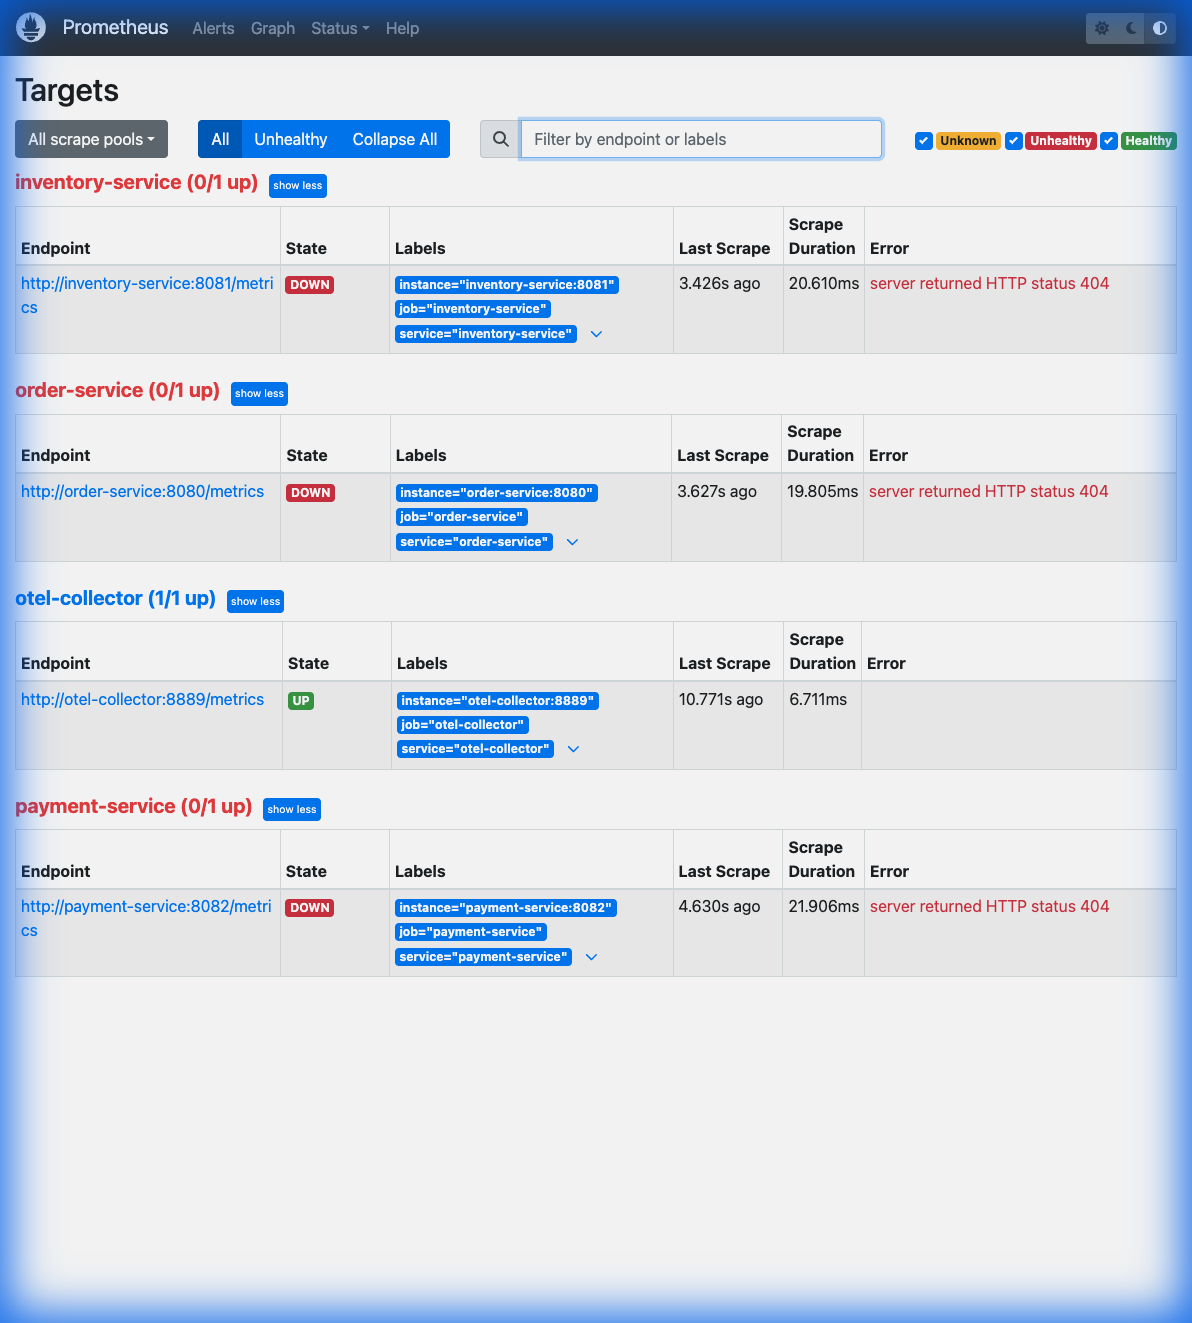 Above: Prometheus UI showing all three microservices being successfully scraped.
Enable Metrics Export
Run your services with metrics exporter:
java -javaagent:opentelemetry-javaagent.jar \
  -Dotel.service.name=order-service \
  -Dotel.metrics.exporter=prometheus \
  -Dotel.exporter.prometheus.port=8080 \
  -jar order-service.jar
Creating Custom Metrics
Here’s a complete example with all three metric types:
@Service
public class OrderMetrics {

    private final Meter meter;
    private final LongCounter ordersCreated;
    private final LongCounter ordersFailed;
    private final DoubleHistogram orderValue;
    private final AtomicLong activeOrders = new AtomicLong(0);

    public OrderMetrics() {
        this.meter = GlobalOpenTelemetry.getMeter("order-service");

        // Counter: Orders created
        this.ordersCreated = meter.counterBuilder("orders.created")
            .setDescription("Total orders created")
            .setUnit("1")
            .build();

        // Counter: Failed orders
        this.ordersFailed = meter.counterBuilder("orders.failed")
            .setDescription("Total failed orders")
            .setUnit("1")
            .build();

        // Histogram: Order values
        this.orderValue = meter.histogramBuilder("orders.value")
            .setDescription("Order value distribution")
            .setUnit("USD")
            .build();

        // Gauge: Active orders in processing
        meter.gaugeBuilder("orders.active")
            .setDescription("Orders currently being processed")
            .buildWithCallback(measurement ->
                measurement.record(activeOrders.get())
            );
    }

    public void recordOrderCreated(String orderType, double amount) {
        ordersCreated.add(1, Attributes.of(
            AttributeKey.stringKey("order.type"), orderType
        ));
        orderValue.record(amount);
    }

    public void recordOrderFailed(String reason) {
        ordersFailed.add(1, Attributes.of(
            AttributeKey.stringKey("failure.reason"), reason
        ));
    }

    public void incrementActiveOrders() {
        activeOrders.incrementAndGet();
    }

    public void decrementActiveOrders() {
        activeOrders.decrementAndGet();
    }
}
Using the Metrics
@Service
@RequiredArgsConstructor
public class OrderService {

    private final OrderMetrics metrics;

    public Order createOrder(OrderRequest request) {
        metrics.incrementActiveOrders();

        try {
            // Process order
            Order order = processOrder(request);

            metrics.recordOrderCreated(
                request.getOrderType(),
                request.getAmount().doubleValue()
            );

            return order;

        } catch (Exception e) {
            metrics.recordOrderFailed(e.getClass().getSimpleName());
            throw e;

        } finally {
            metrics.decrementActiveOrders();
        }
    }
}
Cardinality: The Silent Performance Killer
Critical: High-cardinality attributes will explode your metrics storage.
// BAD - orderId has infinite cardinality
counter.add(1, Attributes.of(
    AttributeKey.stringKey("order.id"), orderId  // Millions of unique values!
));

// GOOD - orderType has low cardinality
counter.add(1, Attributes.of(
    AttributeKey.stringKey("order.type"), orderType  // ~5 unique values
));
Safe attributes: status codes, regions, order types, customer tiers
Dangerous attributes: user IDs, order IDs, timestamps, emails
Building a Grafana Dashboard
Access Grafana at http://localhost:3000 (admin/admin).
Add Prometheus Data Source
- Go to Configuration → Data Sources
- Add Prometheus
- URL:
http://prometheus:9090 - Click Save & Test
Example Dashboard Panels
Request Rate (Counter):
rate(orders_created_total[5m])
Error Rate (%):
rate(orders_failed_total[5m]) / rate(orders_created_total[5m]) * 100
P95 Order Value (Histogram):
histogram_quantile(0.95, rate(orders_value_bucket[5m]))
Active Orders (Gauge):
orders_active
Correlating Metrics with Traces
The power comes when you connect them:
- Alert on metric: Error rate spikes above 5%
- Filter traces: Find traces with errors in that timeframe
- Debug: Examine specific failing requests
With the OTel Collector (Part 6), you can automatically add trace_id to metrics for direct correlation.
Auto-Instrumented Metrics
The Java Agent provides these metrics out-of-the-box:
| Metric | Description |
|---|---|
http.server.duration |
HTTP request latency histogram |
http.server.active_requests |
Current in-flight requests |
db.client.connections.usage |
Database connection pool |
jvm.memory.used |
JVM heap usage |
jvm.gc.duration |
Garbage collection time |
What’s Next
You have traces enriched with business context and custom metrics for operational visibility.
In Part 5, we’ll complete the observability story with structured logging:
- Adding trace/span IDs to logs
- JSON logging for log aggregation
- Correlating logs with traces