The OpenTelemetry Collector: Deep Dive
Part 7 of an 8-part series on implementing observability in Java microservices
The OpenTelemetry Collector is the unsung hero of the observability stack. It’s a vendor-neutral proxy that sits between your applications and your backend (Jaeger, Datadog, Prometheus).
[!NOTE] Try It Yourself: The
otel-demodirectory contains a fully functional collector setup with three microservices. Rundocker-compose upto see the collector in action with Jaeger, Prometheus, and Grafana.
Why not send directly?
You can send telemetry directly from your Java app to Jaeger. But what if you want to switch to Datadog later? You’d have to redeploy every single microservice with new credentials and SDK configurations.
With the Collector:
- Apps send to Collector (via OTLP).
- Collector sends to Jaeger + Datadog + S3.
Your apps never know where the data ends up.
The Architecture: Receivers, Processors, Exporters
The Collector is an ETL (Extract, Transform, Load) pipeline.
graph LR
    App[Java App] -->|OTLP| Receiver
    subgraph Collector
    Receiver --> Processor1[Batch]
    Processor1 --> Processor2[Filter]
    Processor2 --> Processor3[Attributes]
    Processor3 --> Exporter1[Jaeger]
    Processor3 --> Exporter2[Prometheus]
    end
    Exporter1 --> JaegerDB
    Exporter2 --> PromDB
1. Receivers (Input)
How data gets IN.
- OTLP: The standard OTel protocol (gRPC/HTTP).
- Jaeger/Zipkin: For legacy apps.
- Host Metrics: CPU/Memory of the collector host itself.
2. Processors (Transformation)
The magic happens here. Processors run in order.
The Batch Processor (Mandatory)
Buffers telemetry to send in chunks. Drastically reduces network calls.
processors:
  batch:
    timeout: 1s
    send_batch_size: 1024
The Memory Limiter (Safety)
Prevents the Collector from crashing (OOM) if traffic spikes. Always put this first.
processors:
  memory_limiter:
    check_interval: 1s
    limit_mib: 1000        # Soft limit
    spike_limit_mib: 200   # Hard buffer
The Attributes Processor (Scrubbing PII)
Use this to remove sensitive data like passwords or credit cards before they leave your infrastructure.
processors:
  attributes:
    actions:
      - key: db.statement
        action: delete  # Don't log raw SQL queries
      - key: credit_card
        action: hash    # Hash sensitive fields
3. Exporters (Output)
Where data goes.
- OTLP: To another collector (load balancing).
- Prometheus: Exposes a
/metricsendpoint for scraping. - Logging: Prints to stdout (great for debugging).
The “Gateway” vs “Agent” Pattern
Pattern A: Despair (Direct)
Every app talks to the vendor.
- Pros: Easy demo.
- Cons: Security nightmare (API keys in every app).
Pattern B: The Agent (DaemonSet)
One collector on every Kubernetes Node.
- Pros: Apps talk to
localhost. Local caching. - Cons: Resource intensive on small clusters.
Pattern C: The Gateway (Deployment)
A centralized cluster of Collectors.
- Pros: Central management. Scalable.
- Cons: Single point of failure (run HA replicas!).
Configuration Example
Here is a production-ready config.yaml:
receivers:
  otlp:
    protocols:
      grpc: { endpoint: "0.0.0.0:4317" }
      http: { endpoint: "0.0.0.0:4318" }

processors:
  memory_limiter:
    check_interval: 1s
    limit_mib: 1536
    spike_limit_mib: 512
  batch:
    timeout: 1s
  resourcedetection:
    detectors: [env, system] # Add 'host.name', 'os.type' automatically

exporters:
  otlp/honeycomb:
    endpoint: "api.honeycomb.io:443"
    headers:
      "x-honeycomb-team": "${HONEYCOMB_API_KEY}"
  logging:
    verbosity: detailed

service:
  pipelines:
    traces:
      receivers: [otlp]
      processors: [memory_limiter, resourcedetection, batch]
      exporters: [otlp/honeycomb]
Enter the OpenTelemetry Collector—the central nervous system of your observability pipeline.
Why You Need the Collector
Direct export from apps:
App 1 → Jaeger
App 2 → Jaeger
App 3 → Jaeger
Problems:
- Every app needs backend credentials
- Can’t change backends without app redeployment
- No centralized sampling or filtering
- Apps impacted by backend downtime
With the Collector:
App 1 ─┐
App 2 ─┼→ Collector → Jaeger
App 3 ─┘             → Prometheus
                     → Datadog
Benefits:
- Single configuration point
- Apps are insulated from backend changes
- Centralized sampling and transformation
- Buffering during backend outages
Collector Architecture
The Collector has three main components:
┌──────────────────────────────────────────────────────┐
│                  OTel Collector                       │
│                                                       │
│  Receivers    →    Processors    →    Exporters      │
│  (OTLP, Jaeger)    (batch, filter)   (OTLP, Prom)   │
└──────────────────────────────────────────────────────┘
- Receivers: Ingest telemetry (OTLP, Jaeger, Zipkin, Kafka)
- Processors: Transform, filter, batch, sample
- Exporters: Send to backends (Jaeger, Prometheus, vendors)
Basic Collector Configuration
Create otel-collector-config.yaml:
receivers:
  otlp:
    protocols:
      grpc:
        endpoint: 0.0.0.0:4317
      http:
        endpoint: 0.0.0.0:4318

processors:
  batch:
    timeout: 5s
    send_batch_size: 1000

  resource:
    attributes:
      - key: environment
        value: production
        action: insert

exporters:
  otlp/jaeger:
    endpoint: jaeger:4317
    tls:
      insecure: true

  prometheus:
    endpoint: 0.0.0.0:8889

  logging:
    verbosity: detailed

service:
  pipelines:
    traces:
      receivers: [otlp]
      processors: [batch, resource]
      exporters: [otlp/jaeger, logging]

    metrics:
      receivers: [otlp]
      processors: [batch, resource]
      exporters: [prometheus]

    logs:
      receivers: [otlp]
      processors: [batch]
      exporters: [logging]
Docker Compose with Collector
Complete stack:
version: '3.8'
services:
  otel-collector:
    image: otel/opentelemetry-collector-contrib:0.91.0
    container_name: otel-collector
    command: ["--config=/etc/otel-collector-config.yaml"]
    volumes:
      - ./otel-collector-config.yaml:/etc/otel-collector-config.yaml
    ports:
      - "4317:4317"   # OTLP gRPC
      - "4318:4318"   # OTLP HTTP
      - "8889:8889"   # Prometheus metrics
    depends_on:
      - jaeger

  jaeger:
    image: jaegertracing/all-in-one:1.53
    ports:
      - "16686:16686"
    environment:
      - COLLECTOR_OTLP_ENABLED=true

  prometheus:
    image: prom/prometheus:v2.48.0
    ports:
      - "9090:9090"
    volumes:
      - ./prometheus.yml:/etc/prometheus/prometheus.yml

  grafana:
    image: grafana/grafana:10.2.0
    ports:
      - "3000:3000"
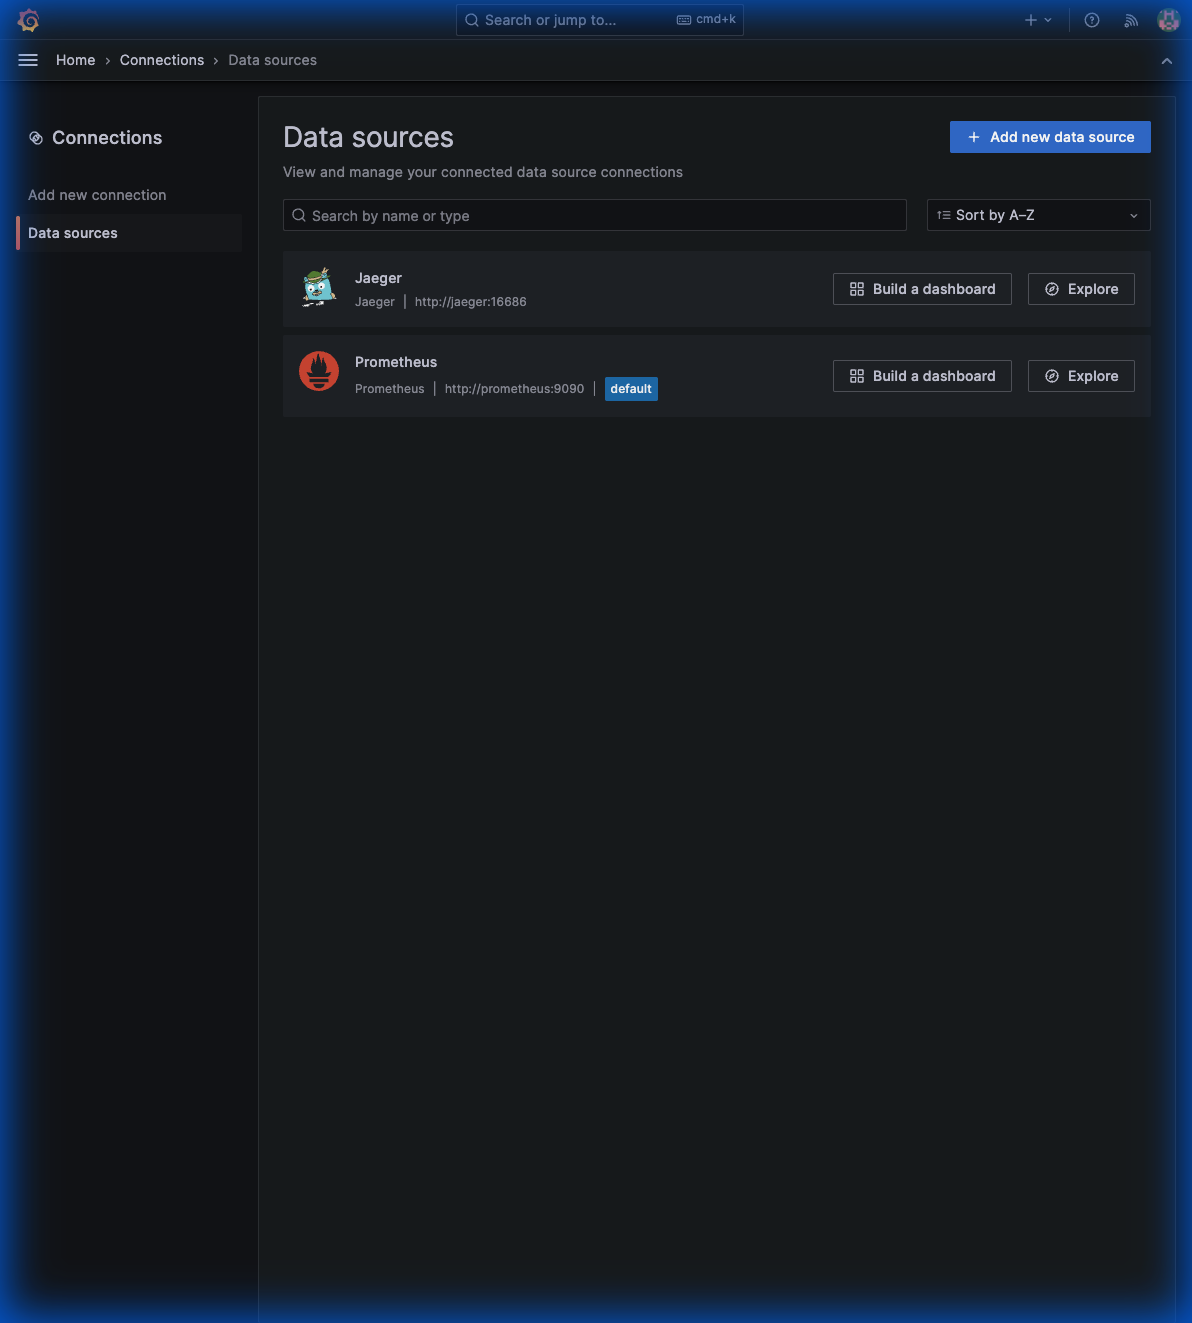 Above: Grafana configured with both Jaeger and Prometheus as data sources, ready for unified visualization.
Now point your apps to the collector:
java -javaagent:opentelemetry-javaagent.jar \
  -Dotel.service.name=order-service \
  -Dotel.exporter.otlp.endpoint=http://localhost:4317 \
  -jar order-service.jar
Sampling Strategies
In production, you can’t keep 100% of traces. Sampling reduces costs while preserving visibility.
Head-Based Sampling
Decide at trace start whether to sample:
processors:
  probabilistic_sampler:
    sampling_percentage: 10  # Keep 10% of traces
Pros: Simple, low overhead
Cons: Might miss interesting traces
Tail-Based Sampling
Decide after seeing the complete trace:
processors:
  tail_sampling:
    decision_wait: 10s
    policies:
      # Always keep errors
      - name: errors
        type: status_code
        status_code:
          status_codes: [ERROR]

      # Always keep slow requests
      - name: slow-requests
        type: latency
        latency:
          threshold_ms: 1000

      # Sample 10% of everything else
      - name: probabilistic
        type: probabilistic
        probabilistic:
          sampling_percentage: 10
Pros: Keeps interesting traces
Cons: Requires memory, more complex
Recommended Strategy
policies:
  # Keep all errors (critical for debugging)
  - name: errors
    type: status_code
    status_code:
      status_codes: [ERROR]

  # Keep slow requests (99th percentile+)
  - name: high-latency
    type: latency
    latency:
      threshold_ms: 2000

  # Sample 5% of successful fast requests
  - name: baseline
    type: probabilistic
    probabilistic:
      sampling_percentage: 5
Multi-Backend Export
Send to multiple destinations:
exporters:
  # Open source backends
  otlp/jaeger:
    endpoint: jaeger:4317

  prometheus:
    endpoint: 0.0.0.0:8889

  # Vendor backend
  otlp/datadog:
    endpoint: https://otel.datadoghq.com:4317
    headers:
      DD-API-KEY: "${DD_API_KEY}"

service:
  pipelines:
    traces:
      receivers: [otlp]
      processors: [batch]
      exporters: [otlp/jaeger, otlp/datadog]
Kubernetes Deployment Patterns
Sidecar Pattern
One collector per pod:
apiVersion: apps/v1
kind: Deployment
spec:
  template:
    spec:
      containers:
        - name: app
          image: order-service:latest
          env:
            - name: OTEL_EXPORTER_OTLP_ENDPOINT
              value: "http://localhost:4317"

        - name: otel-collector
          image: otel/opentelemetry-collector:0.91.0
          ports:
            - containerPort: 4317
Pros: Isolation, per-app config
Cons: Resource overhead
DaemonSet Pattern
One collector per node:
apiVersion: apps/v1
kind: DaemonSet
metadata:
  name: otel-collector
spec:
  selector:
    matchLabels:
      app: otel-collector
  template:
    spec:
      containers:
        - name: otel-collector
          image: otel/opentelemetry-collector:0.91.0
          ports:
            - containerPort: 4317
              hostPort: 4317
Pros: Lower resource usage
Cons: Shared config, noisy neighbor risk
Gateway Pattern
Central collector deployment:
apiVersion: apps/v1
kind: Deployment
metadata:
  name: otel-collector-gateway
spec:
  replicas: 3
  template:
    spec:
      containers:
        - name: otel-collector
          image: otel/opentelemetry-collector:0.91.0
Pros: Centralized, easy to manage
Cons: Single point of failure (mitigate with HA)
Resource Attributes
Enrich all telemetry with context:
processors:
  resource:
    attributes:
      - key: deployment.environment
        value: production
        action: insert
      - key: service.namespace
        value: ecommerce
        action: insert
      - key: k8s.cluster.name
        value: prod-us-east-1
        action: insert
Or use the resource detection processor:
processors:
  resourcedetection:
    detectors: [env, system, docker, gcp, aws, azure]
Common Pitfalls
1. Missing TLS in Production
# Bad - insecure in production
exporters:
  otlp:
    endpoint: collector:4317
    tls:
      insecure: true

# Good - proper TLS
exporters:
  otlp:
    endpoint: collector:4317
    tls:
      cert_file: /certs/client.crt
      key_file: /certs/client.key
2. No Memory Limits
# Add memory limiting
processors:
  memory_limiter:
    check_interval: 1s
    limit_mib: 512
    spike_limit_mib: 128
3. No Retry on Failure
exporters:
  otlp:
    endpoint: backend:4317
    retry_on_failure:
      enabled: true
      initial_interval: 5s
      max_interval: 30s
Final Architecture
┌─────────────────────────────────────────────────────────────────┐
│                     Kubernetes Cluster                          │
│                                                                  │
│  ┌──────────┐ ┌──────────┐ ┌──────────┐                        │
│  │ Order    │ │Inventory │ │ Payment  │  Applications           │
│  │ Service  │ │ Service  │ │ Service  │  (with OTel Agent)      │
│  └────┬─────┘ └────┬─────┘ └────┬─────┘                        │
│       │            │            │                               │
│       └────────────┼────────────┘                               │
│                    │ OTLP                                       │
│                    ▼                                            │
│            ┌──────────────┐                                     │
│            │    OTel      │  Collector                          │
│            │  Collector   │  (sampling, batching, routing)      │
│            └──────┬───────┘                                     │
│                   │                                             │
│     ┌─────────────┼─────────────┐                              │
│     ▼             ▼             ▼                              │
│ ┌────────┐  ┌──────────┐  ┌─────────┐                         │
│ │ Jaeger │  │Prometheus│  │ Grafana │  Backends                │
│ │(traces)│  │(metrics) │  │ (viz)   │                         │
│ └────────┘  └──────────┘  └─────────┘                         │
└─────────────────────────────────────────────────────────────────┘
Series Recap
We’ve covered the complete journey:
- Fundamentals: Traces, metrics, logs, OTel architecture
- Auto-Instrumentation: Zero-code tracing with Java Agent
- Custom Instrumentation: Business context with spans & attributes
- Metrics: Counters, gauges, histograms, Grafana dashboards
- Logs: Trace correlation, structured logging
- Production: Collector, sampling, Kubernetes patterns
You now have everything needed to implement production-grade observability in your Java microservices.
Production Security & Hardening
When deploying the Collector in production, follow these security best practices:
- Receiver Authentication: Use the
authextension to require API keys or OIDC tokens for ingestion. - TLS Everywhere: Always enable TLS for both receivers and exporters.
- Internal Telemetry: Use the
health_checkandzpagesextensions to monitor the collector’s internal health without exposing OTLP ports publicly. - Scrubbing Data: Use the
redactionorattributesprocessor to remove sensitive PII (emails, tokens) at the edge.